Posts

Showing posts from 2012

Strip Tillage Benefits

Image
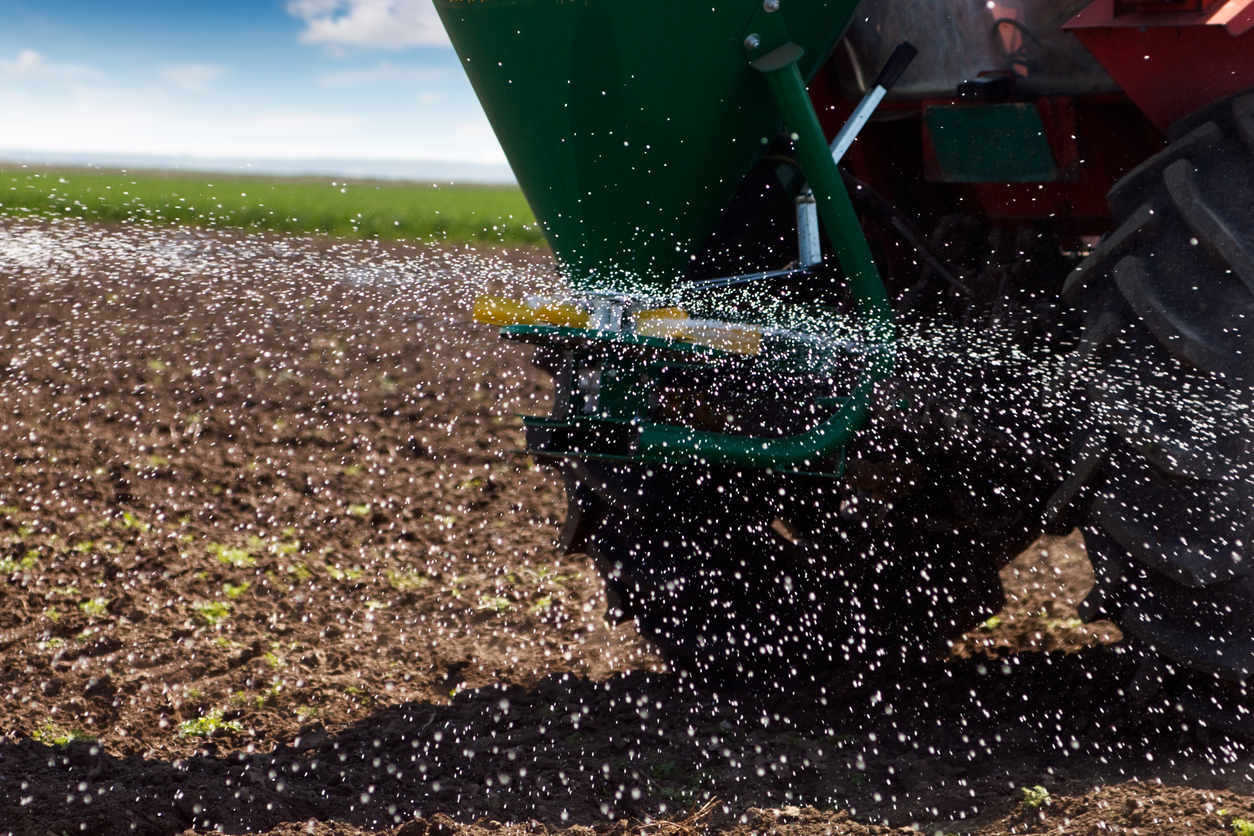
Area motorist may be seeing a different type of tillage being performed on farm fields in the county. Albert Maag, Putnam County SWCD technician recently acquired a USDA-NRCS Conservation Innovation Grant (CIG) to investigate using a strip-tiller to incorporate fall fertilizer. Five demonstration sites consisting of 40 acres each were completed last week. The demonstrations are located around Ottawa (2), Glandorf, Kalida, and Pandora. Blanchard Valley Coop is assisting with the equipment for the demonstrations. The goal of the demonstration plots are to see if strip tillage with fall fertilizer application is a feasible method of producing no-till corn while reducing nutrient runoff, especially phosphorus movement to surface water. The plots used an Orthman® 1 trip strip tiller to place banded fertilizer 7 inches deep in a 10- inch tilled strip. In the spring, farmers would plant on the tilled strips in what is considered a stale seed bed. The advantage of this system is that the ferti

Blanchard River Flooding

Image
In late August 2007, the Blanchard River watershed received between 7 - 9 inches of rainfall overnight and another 1.5 to 3 inches of rain the next day. Tremendous flooding in Findlay and Ottawa occurred; resulting in damaged homes, businesses, and lost property. This rainfall was considered a 100 year flood which is simply the probability of a heavy rainfall event occurring once every 100 years. However, these rare floods events seem to be occurring more often. Dr. Norm Fausey, USDA-ARS soil drainage scientist and I looked at two agricultural best management practices that might be used to reduce this flooding problem. Since agriculture accounts for 85% to 90% of the land area in the Blanchard River watershed, agriculture needs to be a part of the solution. Perhaps we should consider trying to deal with rainfall on a per acre basis basis versus waiting for the water to gain momentum and flow down the river? Overall, the goal should be to increase the water infiltration, increase water

The 4 Rs Concept: Right Rate, Right Place, Right Source, Right Time

Image
The 4R’s concept is being promoted by Ohio State University extension and other government agencies. The 4R’s concept means using the right fertilizer source at the right rate, right time, and the right place (Fertilizer Institute). The goal is to keep the nutrients on the land and not in the air or water while increasing agricultural production and profitability. That requires matching nutrients applied with nutrients taken up by the plants while minimizing losses. For more information on this concept visit the Fertilizer Institute website at nutrientstewardship.com. Using the right fertilizer rate starts with knowing your crop nutrient requirements. The right rate should be based on soil and tissue tests taken from an accredited laboratory and should be based on Tri-state agronomic fertilizer guidelines. Soil tests should be taken a minimum of every three to five years. A study of agricultural testing laboratories found that while a majority of laboratories were testing and reporting

Dealing with Harmful Algal Blooms (HAB) and Dissolved Reactive Phosphorus (DRP)

Image
Our agricultural producers will soon be hearing more about agricultural practices that reduce phosphorus (P) runoff. Ohio State University Extension and government agencies have been developing solutions to harmful algae blooms (HAB) and water quality concerns in Lake Erie and Grand Lake St. Marys. We know that most of the soluble nitrogen (N) and soluble P moves with the water. In a drought year like 2012, P runoff and HABs were not a big issue. However, expect P runoff to become an issue in a normal year with average rainfall. A little history may help explain what has occurred with P runoff in Northwest Ohio. In 1969, Lake Erie was considered a dead lake because it had too much P, HAB, and declining fish (walleye and bass) populations. At that time, about two-thirds of the P was coming from known sources. With soil conservation, new sewage treatment upgrades, and changes to laundry soap; total P in the surface water had declined. By the mid 1990’s, Lake Erie was recovering and fishi

Soil Test Interpretation

Image
 After harvest, most farmers start planning for next year’s crop. Many farmers start by buying and applying fertilizer before the New Year, for income tax purposes. When deciding how much fertilizer to purchase, start with a good soil test. Greg LaBarge, Agronomy Field Specialist and Laura Lindsey, Assistant Professor, Soybeans and Small Grains Production recently wrote a new fact sheet entitled: Interpreting a Soil Test Report, AGF-514-12 which can be found on Ohioline. This fact sheet is the basis for this article. Most standardized soil test report values for pH, phosphorus (P), potassium (K), calcium (Ca), and magnesium (Mg). Soil test values are reported in Parts Per Million (PPM) or pounds per acre. The PPM times 2 equal pounds per acre. It is important to note that the soil test values do not actually tell us how many nutrients are in the soil, they indicate the relative nutrient available for crop production. There are generally much higher levels of nutrients in the soil; howe